MH-Z19 CO2 sensor reader, logger and visualiser

- Reads data from UART(serial)-connected MH-Z19 (or MH-Z14) sensor using python 3.
- If you dare to install nodejs you can visualise the logged data (using html and plotly.js library).
Repository: sammcj/CO2-Logger
Usage
Note this post is from 2016, in 2021 I replaced my custom Co2 loggers with an Aranet4. While very expensive, is and excellent off-the-shelf solution, with many features.
Connection
Sensor can be queried using 3.3v UART at 9600 bps. Sensor main feed voltage is 5v.
Can be connected to computer using almost any USB-UART converter if voltage matches.
Requirements
- Python3
pip3 install serial pyserial- A USB -> Serial UART connector (Could also be used with Raspberry Pi, ESP8266, Arduino etc…)
- MH-Z19 Co2 Sensor (Around $25AUD on eBay)
Querying
$ python3 CO2Reader.py --tty=/dev/tty.SLAB_USBtoUART --timeout=2
Connected to /dev/tty.SLAB_USBtoUART
2019-02-25 07:44:48 558 58
2019-02-25 07:44:49 558 58
2019-02-25 07:44:51 558 58
...
3 fields separated by tab: timestamp, CO2 concentration (ppm), internal sensor temperature (Celsius)
Use stream redirection to save data series to file:
touch co2.log
python3 CO2Reader.py --tty=/dev/tty.SLAB_USBtoUART --timeout=2 >>co2.log
Options
--tty(optional) tty to connect to (default is/dev/tty.SLAB_USBtoUART)--single(optional) perform a single measurement and exit--quit(optional) connect to the sensor and quit immediately--timeout(optional) time between requests (defaults to10seconds)--command(optional) raw command to pass to the sensor - use carefully (default is to read Co2 levels)
Sensor Commands
Raw commands can be passed to the Co2 sensor, these to be used with caution.
Example:
python3 CO2Reader.py --tty=/dev/tty.SLAB_USBtoUART --timeout=1 --command='0xff, 0x01, 0x86, 0x00, 0x00, 0x00, 0x00, 0x00, 0x79'
Default operation (Reads Co2 levels)
0xff, 0x01, 0x86, 0x00, 0x00, 0x00, 0x00, 0x00, 0x79
Enable ABC
0xFF, 0x01, 0x79, 0xA0, 0x00, 0x00, 0x00, 0x00, 0xE6
Disable ABC
0xFF, 0x01, 0x79, 0x00, 0x00, 0x00, 0x00, 0x00, 0x86
Measurement Ranges
(Note: Untested)
- 1000 =
0xFF, 0x01, 0x99, 0x00, 0x00, 0x00, 0x03, 0xE8, 0x7B - 2000 =
0xFF, 0x01, 0x99, 0x00, 0x00, 0x00, 0x07, 0xD0, 0x8F - 3000 =
0xFF, 0x01, 0x99, 0x00, 0x00, 0x00, 0x0B, 0xB8, 0xA3 - 5000 =
0xFF, 0x01, 0x99, 0x00, 0x00, 0x00, 0x13, 0x88, 0xCB
Run Zero Point (400ppm) calibration
- Run this for 10mins + in 400ppm Environment
WARNING: DO NOT RUN THIS UNLESS YOU KNOW WHAT YOU ARE DOING!
0xFF, 0x01, 0x87, 0x00, 0x00, 0x00, 0x00, 0x00, 0x78
Visualizing
- Install npm dependencies
npm install - Start server
python3 -m http.server 8088 --bind 127.0.0.1 - Open browser at http://127.0.0.1:8088/plot.html
- Select your log file in input field
Technical Specifications MH-Z19
| Attribute | Value |
|---|---|
| Target gas | Carbon Dioxide CO2 |
| Operating Voltage | 3.6 to 5.5 Vdc |
| Operating current | < 18mA average |
| Interface levels | 3.3 Vdc |
| Output signal format | UART or PWM |
| Preheat time | 3 min |
| Response time | <60 s |
| Accuracy | ± (50 ppm+5% reading value) |
| Measuring range | 0 to 5000 ppm |
| Operating temperature range | 0 to + 50°C |
| Dimensions | 33mmx20mmx9mm(LxWxH) |
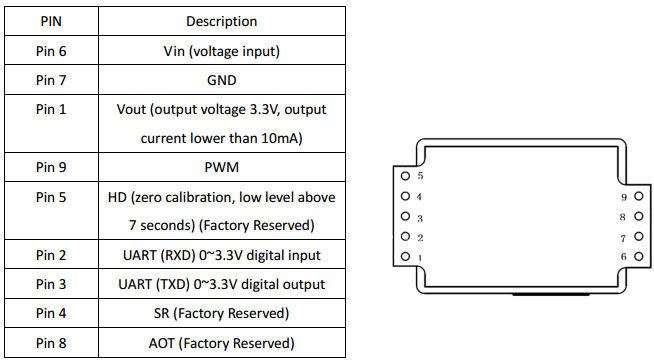
Wiring
| Function | UART / Signal | MH-Z19 pin |
|---|---|---|
| Vcc +5V | +5V | 6 Vin |
| GND | GND | 7 GND |
| UART | TXD0 | 2 RXD |
| UART | RXD0 | 3 TXD |
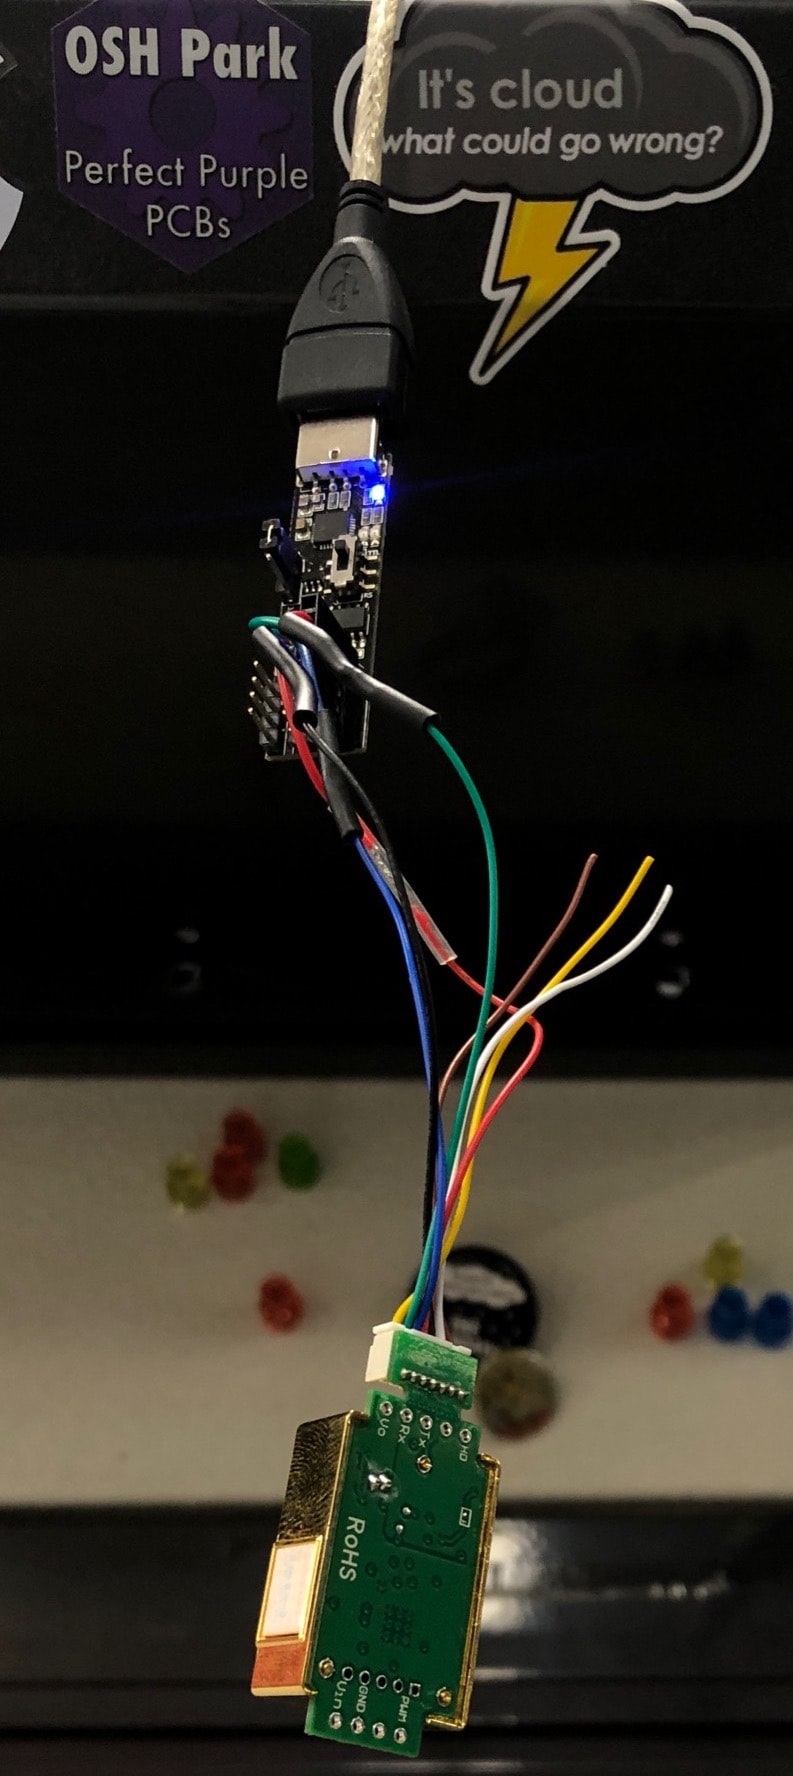
Photos
MH-Z19 Sensors


Connected to a USB -> UART adapter
Calibration
Don’t use this function unless you know what you are doing or you may incorrectly calibrate the sensor!
(Australia has an average of around 400-410PPM and Sensor zero point is 400PPM)

Credits
- Inspiration taken from my old AirQualityLogger project
- Thanks to @matmunn for Python 2->3 upgrade.
- Originally forked from https://github.com/alpacagh/MHZ14-CO2-Logger
Licence
MIT licence